Published Date: February 11, 2026 , Written by: Anand Selvadurai , Category: Digital Transformation, Data Mining
POPULAR POSTS
-
01
Top 10 Companies Offering Software Modernization Consulting Services in 2026
-
02
11 Proven Benefits of AI Chatbots for Businesses in 2025
-
03
How To Improve Document Processing Accuracy Using Document AI
-
04
What Digital Transformation Means for Businesses in 2026
-
05
Top 10 AI Development Companies Offering End-to-End AI Development Services
Data mining is the process of finding patterns and relationships in large data sets. It helps businesses understand what’s really going on, which is often hidden within data. With data mining you can make decisions purely based on data and not by guessing or with gut feeling.
Data mining turns raw data into meaningful structured data. If you look at data on the surface they don’t say much and don’t give you any idea what’s inside. But with the right tools and techniques you can uncover insights which help you make better decisions.
This process relies heavily on machine learning services, statistics and database systems. It scans through huge amounts of data to find patterns that humans miss.
For example, it can show you insights like customers are more likely to buy a product at a certain time of the year and based on that you can plan a detailed marketing campaign and boost your sales.
Not only that but it can also find if certain behaviors lead to fraud. These patterns aren’t obvious just by looking at the data casually.
Data mining is not limited to tech companies but to every business from retail stores to hospitals. The goal of data mining is always the same, to use the data you already have to make smarter choices.
People often confuse data mining and data analytics services which might sound similar but are totally different. Data analytics is a broader concept of interpreting data to support decision making. But data mining is the process of fully discovering patterns in data.
Summary of Key Points
- Data mining finds hidden patterns in big data. It turns numbers into insights you can use. This helps you make better decisions and solve real problems.
- It works by using stats, machine learning and database systems. It finds connections you wouldn’t see otherwise.
- There are two types of learning in data mining. One is supervised learning which uses labeled data. The other is unsupervised learning which looks for structure in unlabeled data.
- Some popular techniques are classification, clustering, regression and association rule mining. These help you group things, find trends or make predictions.
- You’ll find many tools and platforms that make data mining easier. Some of the top ones are RapidMiner, Weka, KNIME, SAS and even Python libraries like scikit-learn.
- Data mining is used in many industries. Retailers use it to recommend products. Banks use it to detect fraud. Hospitals use it to spot risk factors in patients. Every field with data can benefit from it.
- Data mining ultimately helps people make sense of complex information.
Why Data Mining is important

Data mining helps people make smarter decisions and rule out the risk of gut feeling in critical business areas. Most businesses collect a lot of data every day, but on its own, it doesn’t mean much. It just sits there. However, data mining turns that information into useful knowledge.
It helps you find patterns that are not easy to see at first. For example, it can show which products people often buy together. Or which customers are likely to stop using certain services. These small insights can lead to big changes in how a company works.
In healthcare, data mining can help find patterns in patient records. This can lead to better diagnosis and treatment. Whereas in finance, it helps find risky transactions. In marketing, it shows which campaigns work best.
It’s also useful for improving internal operations like finding slow moving areas in a supply chain. Or figure out which steps in a process are wasting time. With this knowledge, your team can address challenges and make things more efficient.
Without data mining, many of the artificial intelligence services may remain meaningless as there is no point if you can’t see through data and make meaningful insights.
In short, data mining helps turn data into value. And in today’s world, that kind of insight is a big deal.
How Does Data Mining Work?
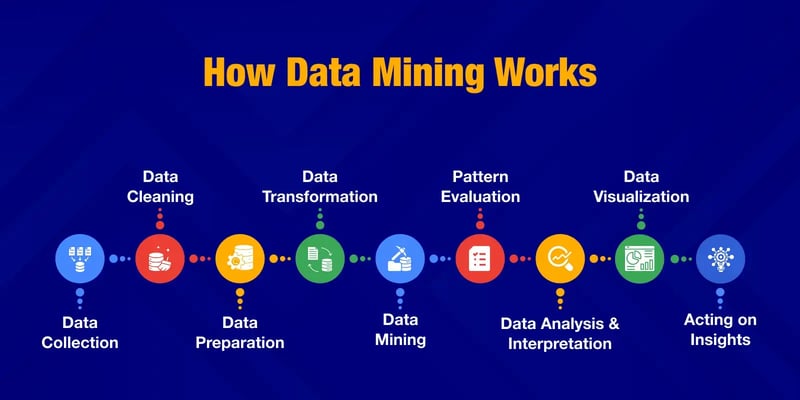
Data mining is a step by step process. Each step plays a crucial role in making sure the final insights are accurate and useful. Let’s go through each step.
1. Data Collection
The process starts with collecting the data. This data can come from many places. It could be customer transactions, website activity, sensor logs, medical records or anything else. The source depends on the problem you’re trying to solve.
The goal at this step is to bring all the required data together in one place. Sometimes it’s stored in databases. Other times it’s in spreadsheets or cloud platforms. You may pull data from multiple systems or services and store in a single repository.
2. Data Cleaning
Raw data is messy. It might have missing values, duplicate entries and other errors. Hence cleaning is so important which removes noise in raw data, fixes errors and deals with blanks.
This step makes sure the data is reliable. If you skip this your results might be wrong. Clean data gives you a solid foundation for everything that comes next.
3. Data Preparation
Once the data is clean you need to format it in a way that works for mining. This can include organizing columns or combining datasets that machines can understand. Talking about making machines understand data, data annotation becomes crucial.
You may also need to reduce the size of the dataset. If it has too many columns it can slow things down so go for feature selection and dimensionality reduction which helps you keep only what you need.
4. Data Transformation
In many cases data has to be transformed before it can be mined. This might mean normalizing values so they fall into the same range. Or converting text labels into numeric codes.
Sometimes data needs to be grouped into buckets or scaled. This step helps prepare the data for algorithms that need things in a specific structure.
5. Data Mining
This is the core step. Here you apply machine learning algorithms to find patterns and relationships in the data. You can use many methods which include classification, clustering, regression or association rule mining.
You usually run several models to test what works best. Some tools also automate this part and suggest the best method based on the data type.
6. Pattern Evaluation
Not all patterns are useful. After mining the data, you have to check which results make sense. Some patterns may happen by chance. Others may be too weak to act on. This step helps you filter out noise and focus on strong, interesting patterns.
7. Data Analysis and Interpretation
Once you have good patterns, it’s time to make sense of them. This step turns technical results into real insights. You look at what the patterns mean for your business or goal.
This is where domain experts come in. A pattern in medical data may mean nothing to a data scientist but a doctor might see something important. So it helps to work with people who know the field.
8. Visualization and Reporting
People understand visuals faster than tables or code. So charts, graphs and dashboards play a big role here. You use visuals to tell a story with the data.
This helps teams see what’s going on. It makes insights easier to share and discuss. A clear report or dashboard can help decision makers take quick action.
9. Acting on Insights
The final step is to put those insights to work. You might change how you market a product. Or flag suspicious transactions. Or update a process to save time.
The value of data mining comes from action. Insight without action is just interesting trivia. This is where the process turns into results.
In summary, data mining is a journey. You start with raw data. You clean it, prepare it, explore it and study the results. And in the end you get real insights that can lead to better decisions.
Supervised vs. Unsupervised Learning in Data Mining

In data mining, most techniques fall under two types of learning - supervised learning and unsupervised learning. Both are useful and solve different types of problems.
Let’s break them down.
What is Supervised Learning?
Supervised learning is used when you already know the outcome you’re looking for. The data comes with labels. These labels show what the result should be.
For example, think about a spreadsheet of emails. Each row says if the email is spam or not spam. You use that labeled data to train a model. Then, the model can predict if a new email is spam.
This type of learning is common in tasks like fraud detection, credit scoring, and also in predicting customer churn.
What is Unsupervised Learning?
Unsupervised learning works with data that has no labels. Here, you don’t tell the system what the outcome should be. Instead, the system looks for patterns on its own.
Let’s say you have customer purchase data, but they have no categories. Unsupervised learning can group similar customers together; these groups are called clusters.
This is useful when you want to explore the data or segment users into different types based on behavior.
Key Differences at a Glance
Let us explore the differences:
| Feature | Supervised Learning | Unsupervised Learning |
|---|---|---|
| Labeled Data | Yes | No |
| Goal | Predict outcomes | Find hidden patterns |
| Examples | Classification, Regression | Clustering, Association |
| Output | Known categories or values | Groups or pattern rules |
| Common Use Cases | Spam detection, loan approval | Customer segmentation, market trends |
Which One Should You Use?
If you already know what you’re trying to predict, go with supervised learning, which is the best available option. However, if you just want to explore the data and see what’s there, your perfect choice would be unsupervised learning.
Both approaches are part of a larger toolkit. Many data mining projects use both, depending on the goal.
What are the Common Data Mining Techniques
There are many ways to explore and learn from data. Some techniques help predict future outcomes. Others help find hidden groups or patterns. Each one has its own purpose. Let’s walk through the most popular data mining techniques.
1. Association Rule Mining
It finds relationships between items in large datasets. It tells you what items often appear together. For example, if someone buys bread, they might also buy butter.
- Finds patterns based on item combinations
- Common in market basket analysis
- Helps with product placement and cross-selling
2. Classification
Classification puts items into groups based on past examples. You train a model using labeled data. Then it can sort new data into categories like “yes” or “no.”
- Works well for tasks like spam detection
- Needs labeled training data
- Output is a fixed set of classes
3. Clustering
Clustering groups similar items together. It looks for patterns in data without using labels. You don’t know the categories ahead of time.
- Finds natural groupings in data
- Often used in customer segmentation
- Works without labeled outcomes
4. Regression
Regression shows how things are related. It helps predict a value, like sales or temperature, based on other values. It’s good when the result is a number.
- Used for predicting continuous values
- Shows strength and direction of relationships
- Simple to understand and apply
5. Sequence and Path Analysis
This method looks at the order of events. It finds patterns in how actions happen over time. For example, which steps people follow on a website before making a purchase.
- Tracks behavior patterns over time
- Useful in fraud detection and web analytics
- Helps understand user journeys
6. Neural Networks
Neural networks are inspired by the human brain. They learn patterns from complex data. They’re good for tasks like image recognition or language processing.
- Works well with large, messy data
- Can model non-linear relationships
- Often used in deep learning systems
7. Decision Trees
Decision trees break down a problem into steps. Each “branch” in the tree asks a question. You follow the branches to reach a result. They are easy to read and explain.
- Easy to visualize and understand
- Works for both classification and regression
- Good for exploring “if-then” rules
8. K-Nearest Neighbors (KNN)
KNN finds the “neighbors” closest to your data point. It predicts based on how nearby data points behaved. It's simple but can be powerful.
- Predicts based on closest matches
- No training step is needed
- Sensitive to scale and distance
9. Predictive Analytics
Predictive analytics uses data to forecast what might happen next. It combines techniques like regression, classification, and decision trees.
- Helps forecast trends and behavior
- Widely used in business planning
- Needs strong historical data to work well
10. Text Mining
Text mining pulls useful insights from unstructured text data. It works on things like emails, reviews, or support tickets.
- Converts text into structured data
- Helps with sentiment and topic analysis
- Often used in customer feedback analysis
11. Anomaly Detection
This technique finds outliers. It shows you when something doesn’t follow the usual pattern. It’s useful for spotting fraud or defects.
- Identifies rare or unusual behavior
- Works in real-time systems
- Useful in security and finance
12. Ensemble Methods
These methods combine multiple models to get better results. By mixing weak learners, you often get a stronger final outcome.
- Uses voting or averaging to improve accuracy
- Helps reduce overfitting
- Examples include Random Forest and Gradient Boosting
Data Mining Software and Tools

Data mining needs the right tools to work. These tools collect, process and analyze lots of data. Some are easy to use. Others are for more complex tasks. The right one depends on your team’s skills and project goals.
Data mining tools market is projected to grow to $2.13 billion in 2029 at a CAGR of 12.9%, according to The Business Research Company.
Some tools have drag-and-drop features. These are great for beginners or business users. No coding knowledge required. You can connect steps in the process with a few clicks. You can clean data, apply models and view results with simple blocks.
There are tools for data scientists and analysts. These require some programming knowledge. They give you more control. You can write code, fine-tune models and handle large datasets with precision.
Open-source tools are another option. They are free to use and often have big communities behind them. Some include Elki, DataMelt, Orange, Rattle, and scikit-learn.
Many of these tools support plugins. This means users can add features as they need. Great for teams that want flexibility and don’t mind getting technical.
Some tools are part of bigger platforms. These might include data storage, cleaning, mining and reporting in one place. They help teams manage the full data journey without switching between apps.
In the end, the best tool is the one that fits the user’s comfort level and the size of the data problem. Some people like tools with simple dashboards. Others like to dive deep into code and scripts. Both types of tools have a place in data mining.
What are the Benefits of Data Mining
Here are the business benefits.
Better Decisions
Data mining helps you make better decisions. It finds patterns in big data that you’d never spot manually. Those patterns tell you what’s working and what’s not. Businesses can plan better and not guess. It also reduces risk by showing early warning signs of problems.
Faster Problem Solving
Data mining speeds up the process and eliminates many manual tasks. You can see where things are going wrong quickly. This saves time and fixes issues before they grow. It works well in IT, healthcare and supply chains. It helps streamline everything from software development services to AI solutions, including AI agents.
Better Customer Understanding
Data mining helps you understand your customers better. It shows buying habits, preferences and patterns. This makes it easier to offer the right product to the right person. When customers feel understood they’ll stay loyal. Businesses can spot new trends and respond before competitors do.
More Efficient
Data mining makes processes more efficient. It can spot steps that slow things down or add no value. By removing those steps teams can get more done with less effort. It’s good in manufacturing, logistics and service delivery. When systems run smoothly costs go down and results go up.
Better Forecasting
One of the biggest benefits of data mining is prediction. It can show you what’s going to happen next based on past trends. This is good for sales forecasting, budgeting and staffing. Knowing what’s coming helps teams prepare better. It also reduces surprises that can hurt performance.
Personalised Experiences
People expect personal service. Data mining delivers that. It learns what each customer likes and tailors offers to match. This makes ads, emails and websites feel more relevant. Personal touches like that increase engagement and conversions. It’s a win-win for both the business and the customer.
Fraud Detection and Security
Data mining is great at spotting unusual behaviour. It can catch things like credit card fraud or suspicious logins. Since it looks at patterns in real time it can raise alerts early. This helps stop problems before they cause damage. It adds an extra layer of security in finance and tech systems.
New Opportunities
Sometimes data will show you something you didn’t expect. A hidden pattern will reveal a new market, a new product or a better way to do things. These will lead to innovation. Businesses that listen to those signals will be ahead of the game.
Data Mining vs Text Mining vs Process Mining
Data Mining
Data mining is the process of finding patterns in structured data. Structured data lives in databases, spreadsheets or data warehouses. This is good for numbers, categories and columns that can be easily organized.
The goal is to find useful trends or hidden insights to make better decisions. For example, a store can use data mining to find which products are bought together.
Text Mining
Text mining works with unstructured data, like emails, customer reviews or social media posts. It’s about understanding language, tone and meaning.
This type of mining uses natural language processing to extract facts, topics or opinions from large amounts of written content. For example, a brand can use text mining to analyze customer feedback and find common complaints or praise.
Process Mining
Process mining is all about understanding how processes work inside a company. It uses event logs from systems like CRM or ERP to show how a task really flows in real life. This helps find slow points, missed steps or things that take longer than expected.
For example, a bank can use process mining to see how long it takes to approve a loan from start to finish and where the delays happen.
Now here’s a simple comparison table:
| Aspect | Data Mining | Text Mining | Process Mining |
|---|---|---|---|
| Type of Data | Structured data (tables, numbers) | Unstructured text (documents, reviews) | Event logs from systems |
| Main Focus | Discover patterns and trends | Extract meaning from text | Analyze real workflows and timelines |
| Common Use Case | Customer behavior analysis | Sentiment analysis | Process optimization |
| Techniques Used | Classification, clustering, etc. | NLP, sentiment detection | Workflow reconstruction, bottleneck ID |
Way Ahead
It is evident that data mining is growing fast and is becoming more powerful with the help of AI and machine learning. With ease of accessibility in handling data mining tools, people can now work with data and find insights on the go without strong technical knowledge on using them. Going forward, many businesses will realize the immense potential of data and what it can do. As data keeps growing, smart ways to explore it will be in demand.

Tech.us
Tech.us is an AI development company that builds custom AI solutions for businesses seeking measurable results. We partner with organizations to design, develop, and deploy scalable AI systems that solve complex challenges and unlock new opportunities for growth. Our team delivers practical AI applications that create tangible business impact across industries.
1,500+
Projects
Delivered
Delivered
25+
Years in
Business
Business
30+
Industries
Served
Served
100%
Commitment
to Success
to Success
WRITTEN BY


Get Free Tips
NEWSLETTER
Get Free Tips
Submit to our newsletter to receive exclusive stories delivered to vou inbox!
Thanks for submitting the form.
RECENT POSTS

How to Identify High-ROI AI Automation Opportunities in Your Business
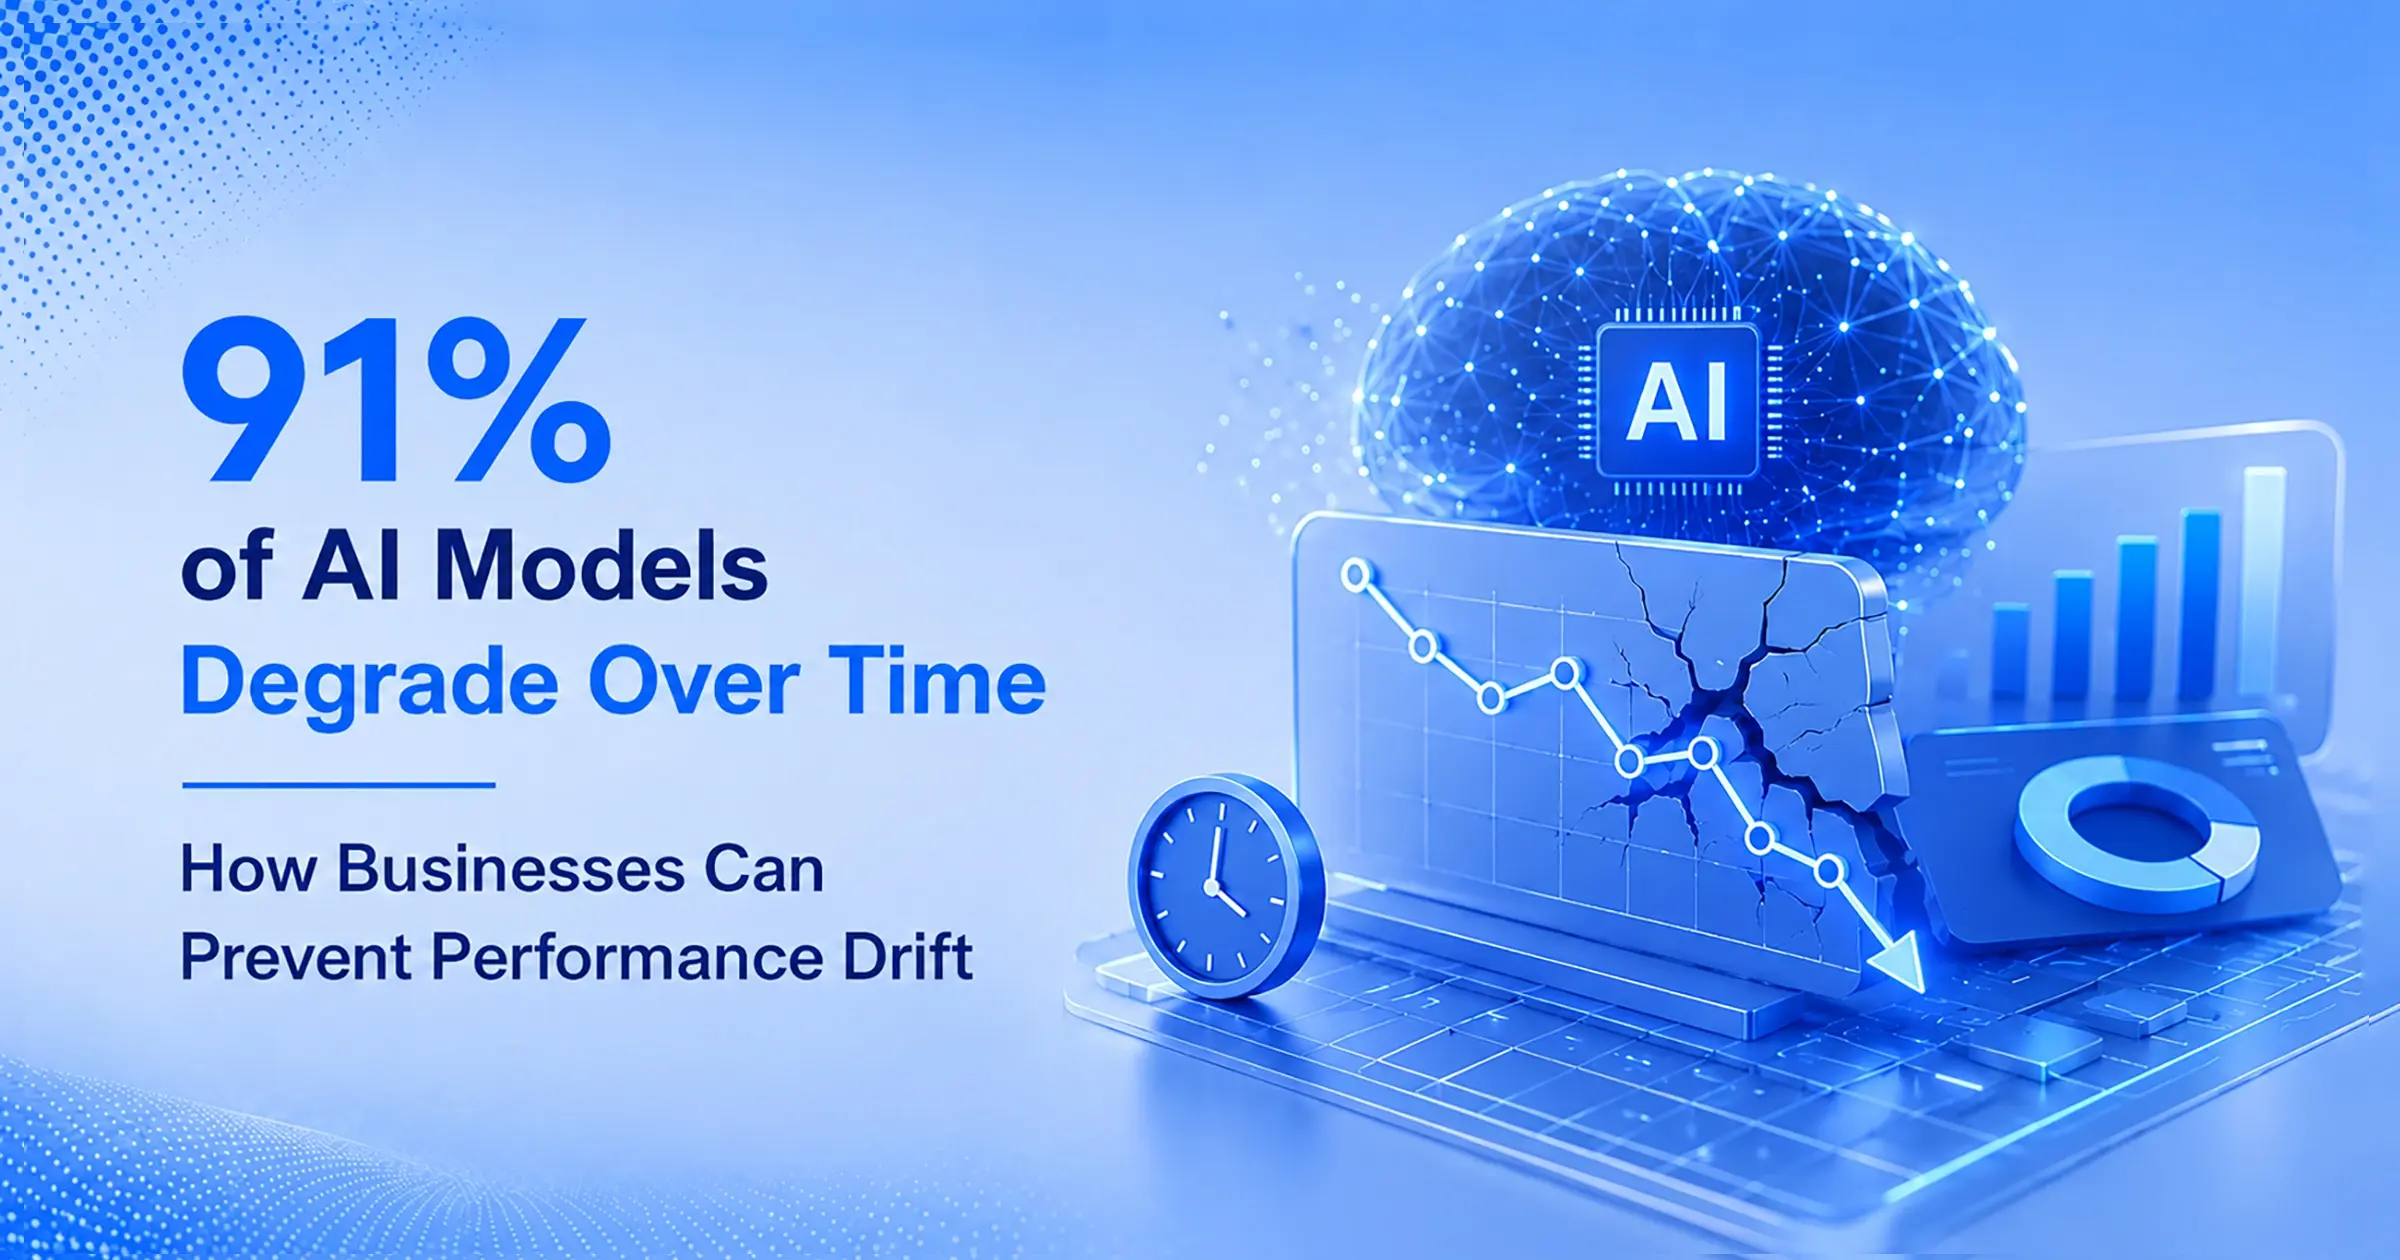
91% of AI Models Degrade Over Time: How Businesses Can Prevent Performance...

7 Enterprise AI Security Risks That Could Derail Your AI Initiative – And...

Why LLMs Alone are Not Enough for Enterprise Agentic AI Systems
How AI Helps Hospitals Predict Patient Admissions, Discharges, and Bed...