Bring Disconnected Data Together
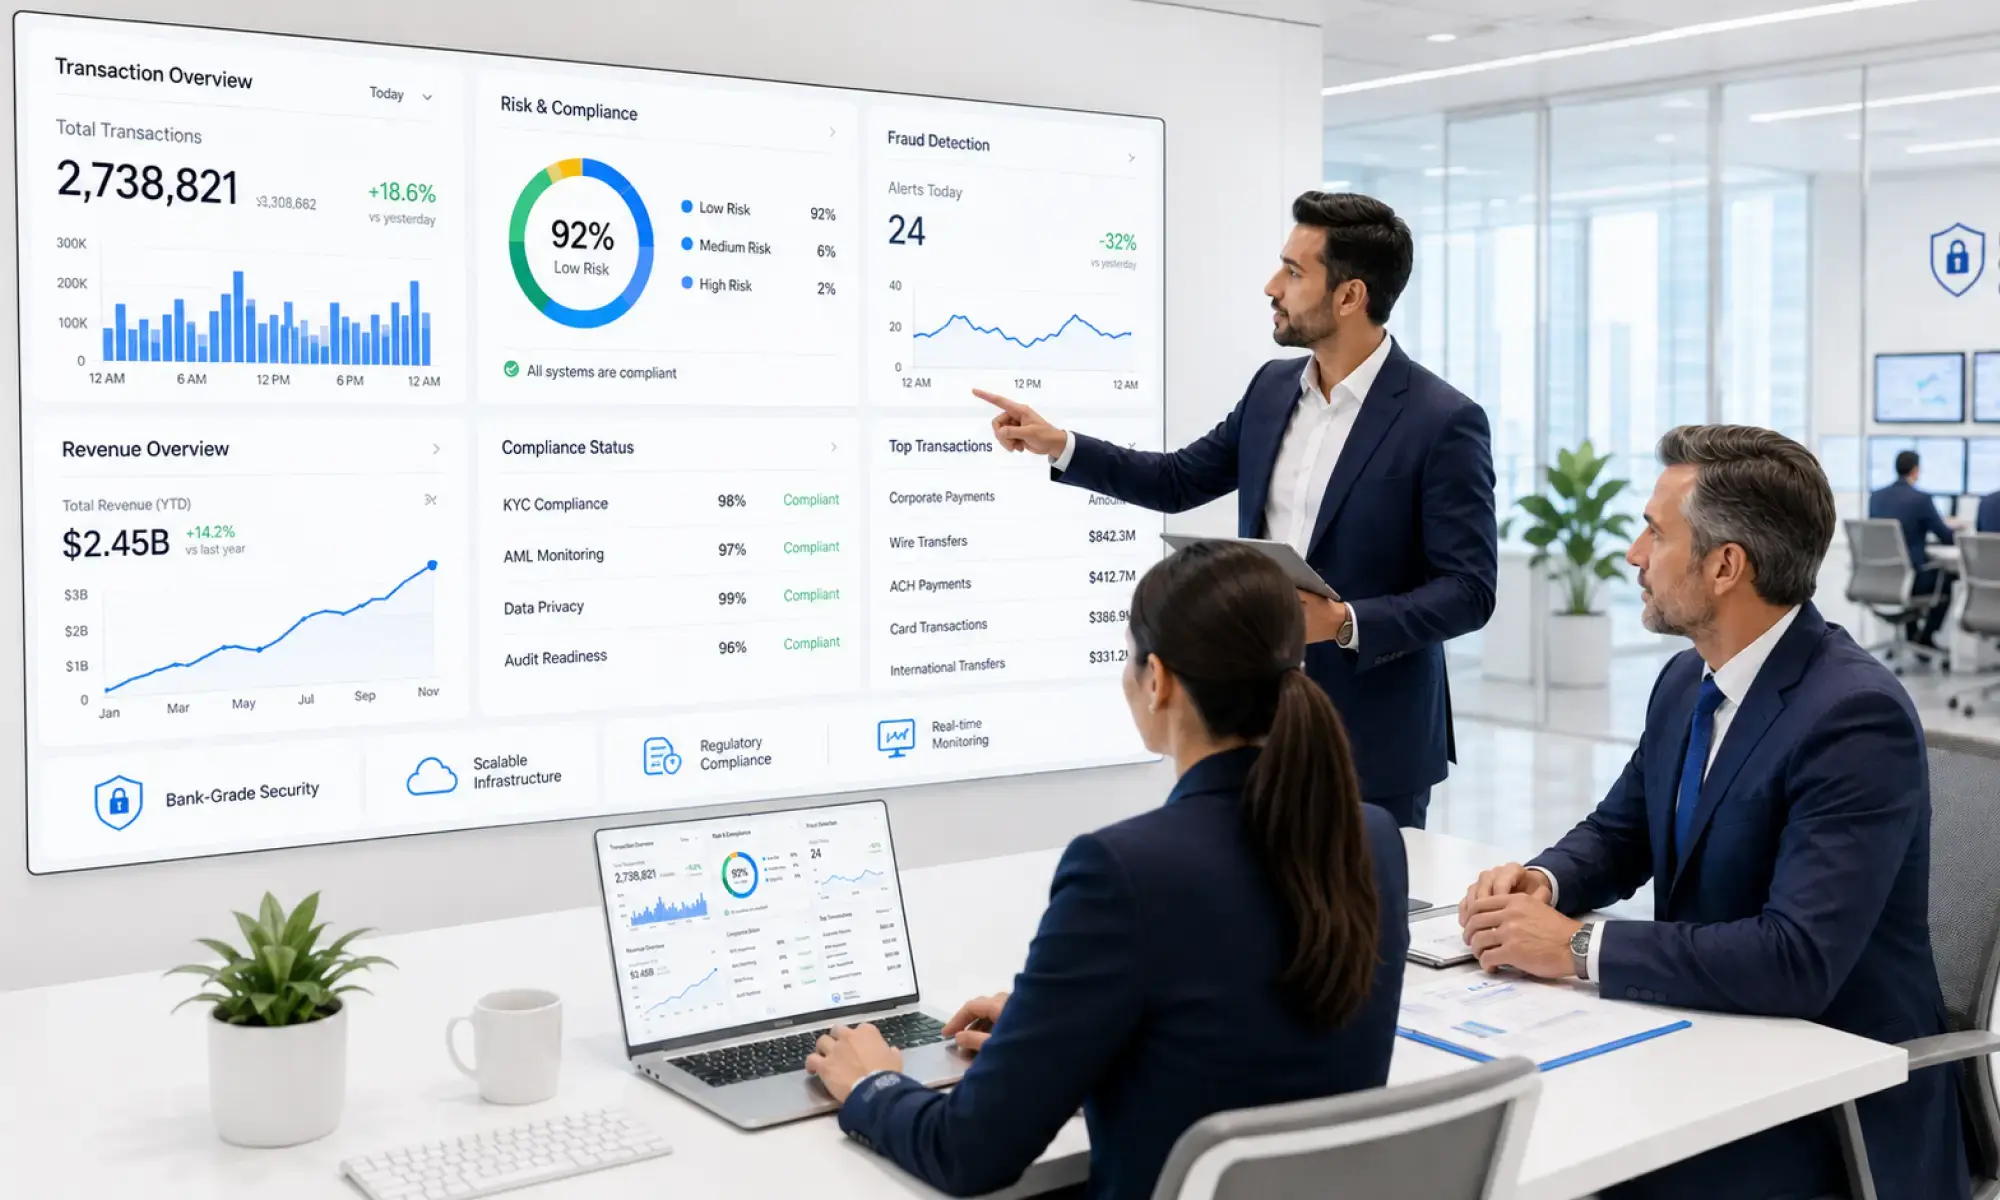
Combine information from different operational systems so analysis is not limited to one application or isolated dataset.
Tech.us helps organizations turn raw and disconnected data into clear analytical insights by bringing information together and identifying the patterns that matter.
Use those insights to understand performance, identify risks and opportunities, and support more informed planning and business decisions.
Projects Delivered
Years of Engineering
Industries Served
TRUSTED BY INDUSTRY LEADERS


DATA OUTCOMES
Useful analytics starts with bringing the right information together and then applying the type of analysis that fits the question.
Combine information from different operational systems so analysis is not limited to one application or isolated dataset.
Turn complex datasets into reports, graphs, and visual outputs that make performance easier to understand.
Look beyond the numbers to identify patterns, relationships, and possible causes behind past and current outcomes.
Use trends and correlations within historical data to support decisions around future activities and business priorities.
Analyze digital customer interactions to identify behavioral patterns across websites and mobile applications.
Use analytics to identify anomalies and potential risk signals across operational, financial, network, and security data.
OUR SERVICES
Tech.us works across the analytics process, from collecting data across systems to explaining past results, examining causes, identifying patterns, and presenting information in a form businesses can use.
Bring data together from sources such as ERPs, CRMs, IoT devices, and servers and consolidate it into a more unified environment for analysis.
Analyze historical trends, correlations, and other patterns to estimate potential future conditions and support planning around activities such as campaigns, launches, and operations.
Use analytical results to evaluate possible courses of action and provide additional context for deciding what steps to consider next.
Apply data mining, discovery, and drill-down techniques to examine historical information and identify patterns or relationships that can help explain why particular outcomes occurred.
Summarize historical and current information through reports, graphs, visualizations, and ad hoc analysis so stakeholders can understand what the data is showing.
Analyze larger volumes of structured and unstructured data and organize complex datasets so useful patterns and information can be extracted.
Analyze customer behavior across websites and mobile applications to better understand how people interact with digital products and services.
Analyze data from operational systems, networks, financial platforms, and cybersecurity environments to identify anomalies and potential areas of risk.
Selected Work
Explore selected projects where Tech.us has turned complex requirements into practical technology designed around business needs.
View All Case Studies

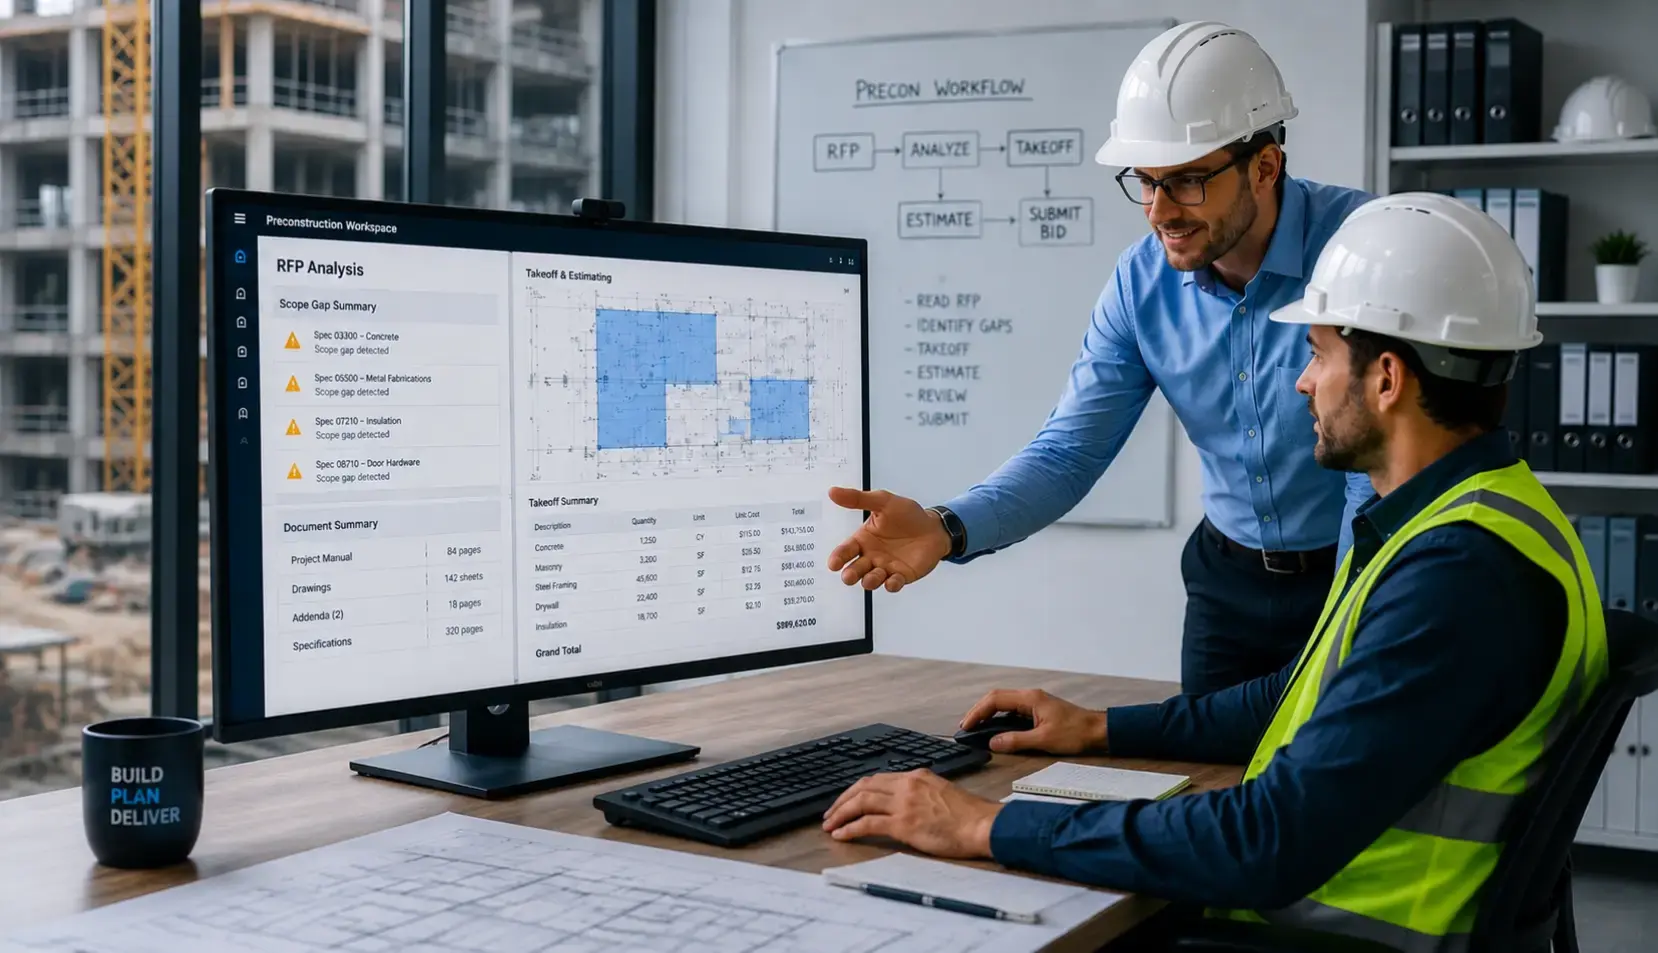
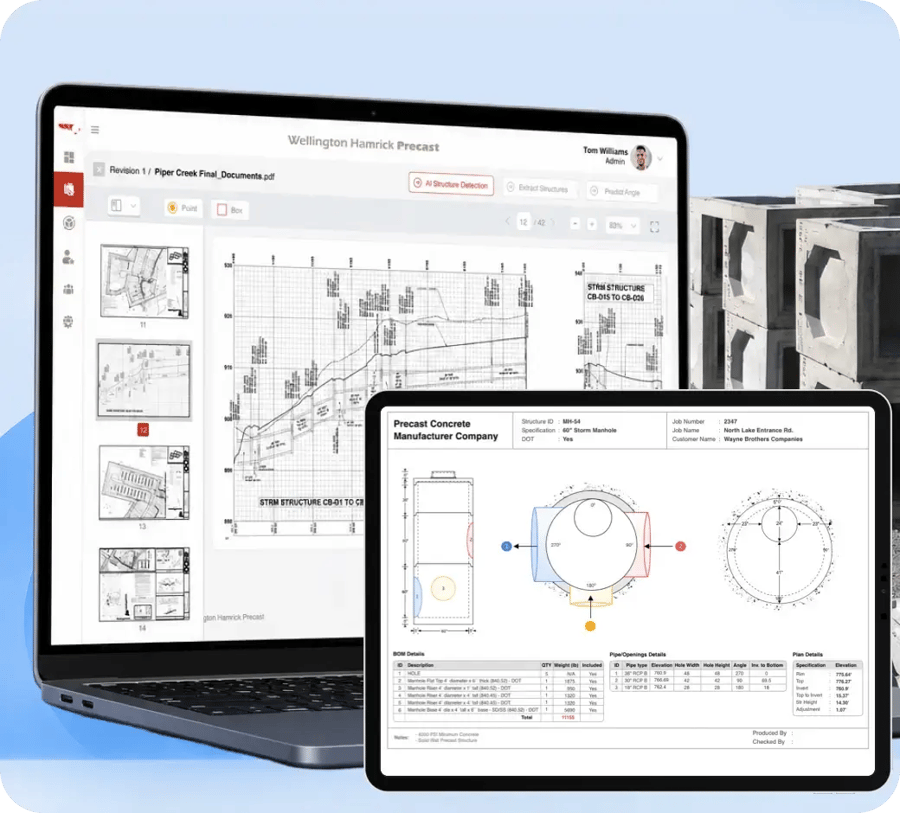
A precast concrete manufacturer partnered with Tech.us to bring AI into the estimating workflow. The system uses OCR, computer vision, and generative AI to identify, extract, and visualize structures, pipes, and components from complex construction drawings.
Read the Case Study

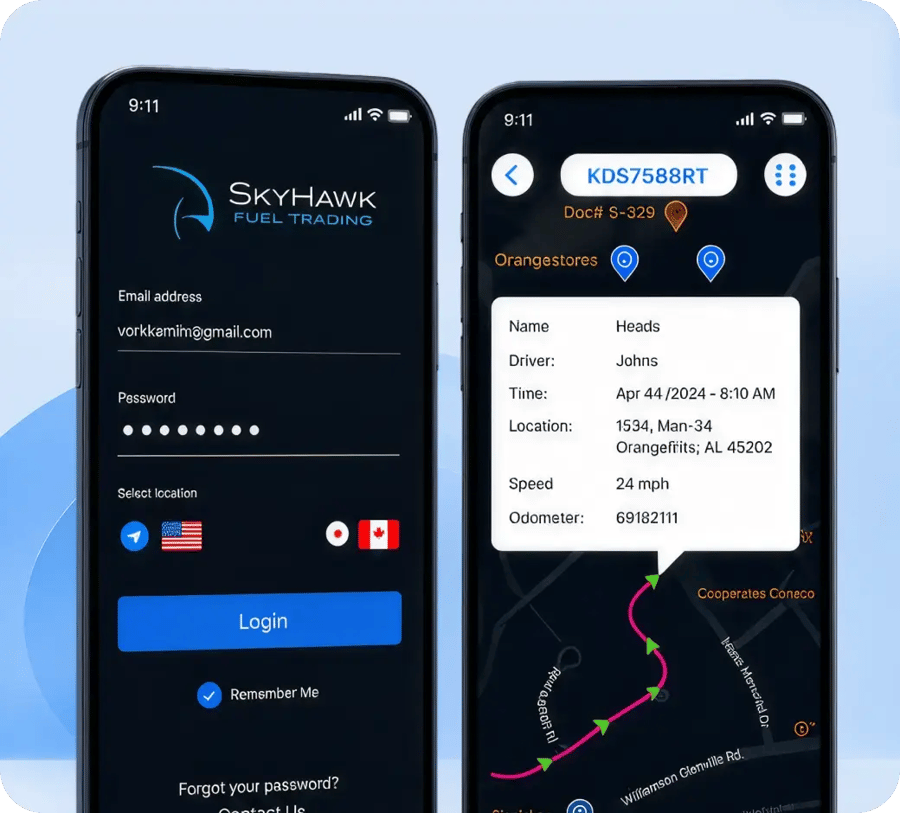
SkyHawk by TELUS needed a streamlined mobile experience for its Connect Anywhere platform. Tech.us built the core experience around real-time asset tracking, fleet activity, secure configuration, and map-based operational visibility.
Read the Case Study

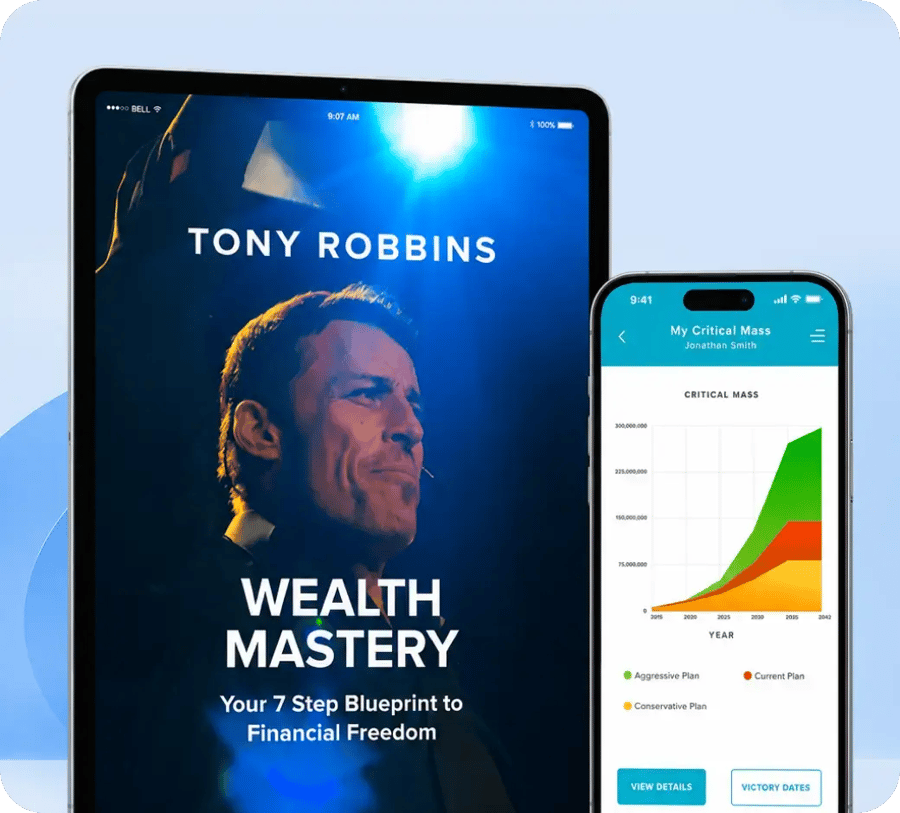
Tech.us helped bring Wealth Mastery to life as a digital platform that puts personalized financial planning tools directly in users' hands while supporting a large and growing audience.
Read the Case Study
WHY TECH.US
Tech.us works across data collection, analysis, visualization, security, and presentation, allowing the analytics work to account for both where the data comes from and how the resulting information needs to be used.
Work with descriptive, diagnostic, predictive, and prescriptive approaches instead of limiting analysis to a single type of reporting.
Bring together information from sources such as ERP platforms, CRM systems, IoT devices, servers, websites, and applications.
Analyze conventional structured datasets as well as larger and less structured sources when the business problem requires both.
Present complex information through reports, graphs, visualizations, and other formats that make findings easier for stakeholders to interpret.
Apply measures such as encryption, multi-factor authentication, and role-based access when analytics involves sensitive information.
Define the business objective first, then plan the data, analysis, and outputs around the question the organization is trying to answer.

HOW WE WORK
The analytics approach depends on what the business needs to understand, which data is available, and how the findings will ultimately be used.
Clarify the business objective, the questions that need to be answered, and the data available to support the analysis.
Define the expected investment based on the scope of data, analytical work, and resources required.
Create a roadmap covering the relevant data sources, analytics activities, and expected outputs before the work begins.
Carry out the analysis and present the resulting information in the agreed reporting or visualization format.
Use analytics to understand performance, identify what is changing, and support the decisions that come next.
Talk To Our Expert →DATA CHALLENGES
Analytics can produce poor answers when the underlying data is incomplete, disconnected, inaccurate, or inadequately protected.
Validate and enrich data before analysis and use data-governance practices and anomaly detection to identify quality issues that could affect the result.
Connect data from different internal and external sources using approaches such as unified data platforms, data lakes, cloud architectures, and ETL processes.
Protect sensitive information with measures such as role-based access, multi-factor authentication, and other appropriate security controls throughout the analytics process.
Support organizations that need additional capability to organize and analyze complex structured or unstructured datasets and interpret the resulting information.
DATA PROCESS
The quality of the final insight depends on what happens before the report or visualization is produced.
Bring organizational data from different sources into a more centralized environment so analysis is not restricted by isolated datasets.
Reduce data silos and make relevant information available across the people who need to work with it while maintaining controls around sensitive data.
Analyze patterns and relationships within the data and represent important findings visually where that makes them easier to interpret.
Present analytical findings in reports and other understandable formats so stakeholders can use the information in business discussions and decisions.
INDUSTRY EXPERIENCE
The datasets may differ, but the underlying requirement is similar: turn operational information into something people can understand and use.
Explore All Industries

Healthcare
Analyze clinical and operational information to improve visibility across care delivery and management activities and support informed decisions.
Explore Healthcare→
Fintech
Use financial and operational data to examine performance, risk patterns, and other information relevant to financial decision-making.
Explore Fintech →

Retail
Analyze customer behavior, inventory movement, and sales performance to improve visibility across retail operations.
Explore Retail →
Manufacturing
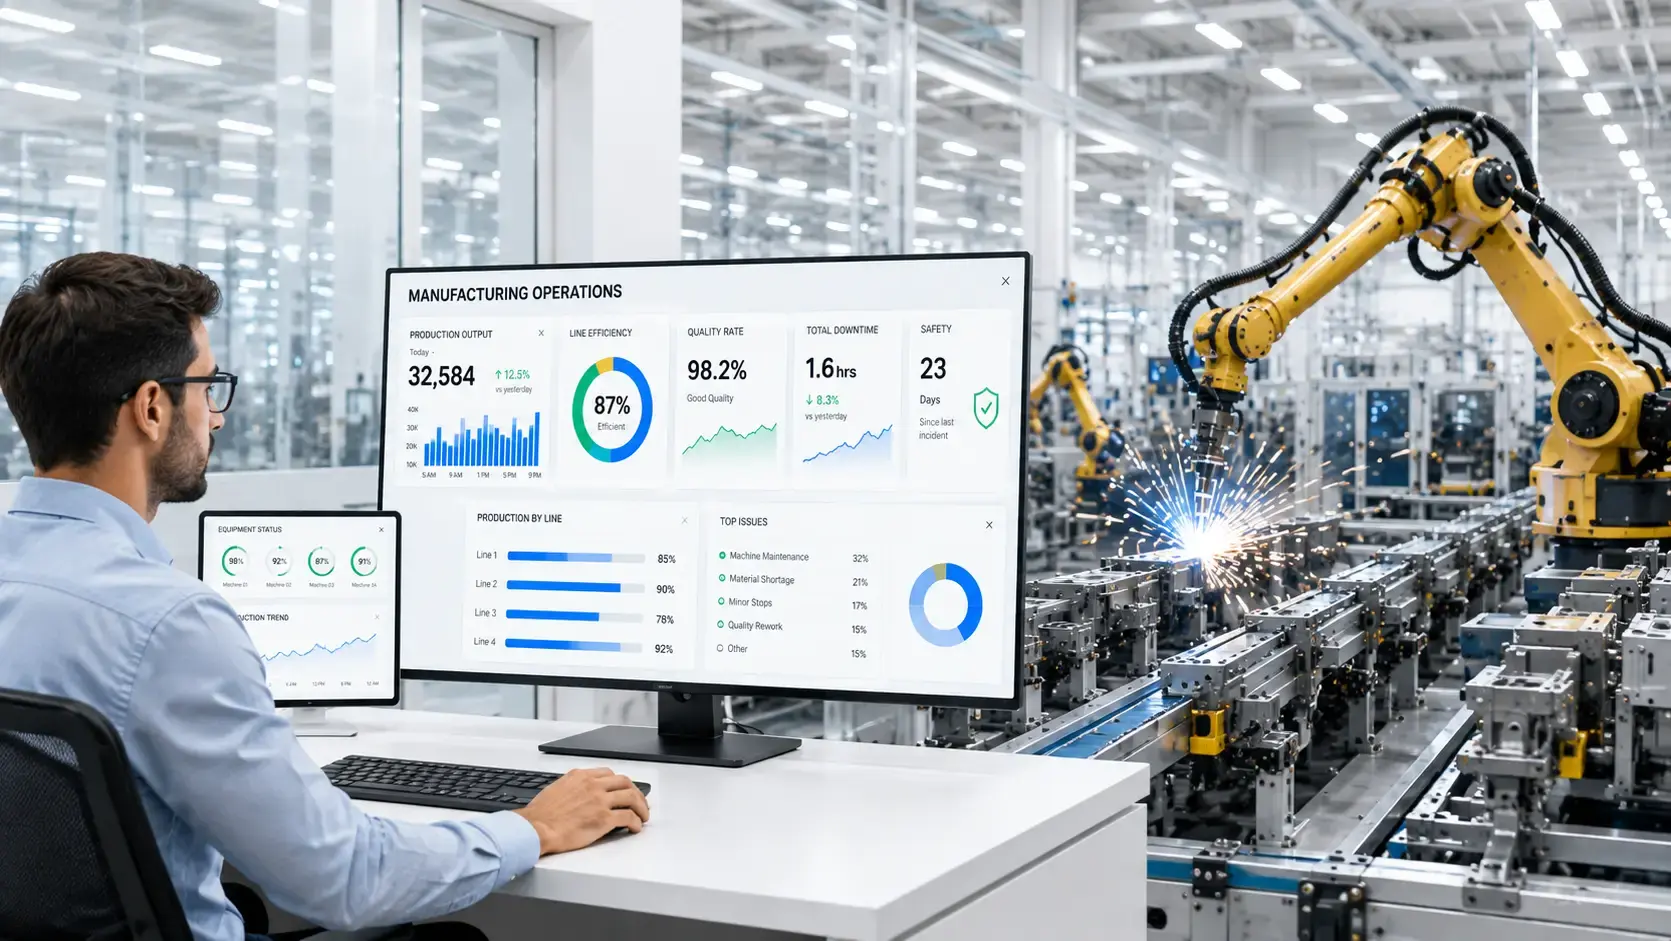
Review production and operational data to identify performance patterns, inefficiencies, and information that can support planning.
Explore Manufacturing→
Real Estate
Analyze market information and property performance to provide additional context for investment and operational decisions.
Explore Real Estate→
Construction
Examine project performance, cost patterns, and operational risks to support planning and project oversight.
Explore Construction→
TECH STACK
Data analytics can involve data sources, analytical models, databases, applications, visualization layers, and cloud infrastructure.
Tech.us works across AI/ML, application, database, and cloud technologies so the stack can be selected around the data being analyzed and how the results need to be delivered.
Agentic AI & Orchestration
Agentic AI
AI Agents
Multi-Agent Systems
Agentic Workflow Automation
Model Context Protocol (MCP)
Agent-to-Agent Protocol (A2A)
Agent Memory and Reasoning
Generative AI & Foundation Models
Large Language Models
GPT
Claude
Gemini
Llama
Generative AI
Multimodal Foundation Models
Diffusion Models
Small Language Models
Model Fine-Tuning
Prompt & Context Engineering
Machine Learning & Deep Learning
Machine Learning
Deep Learning
Predictive Analytics
Recommendation Systems
Anomaly Detection
Time-Series Analysis
Data & AI Platforms
AI-Ready Data Platforms
Data Lakes and Lakehouse
Data Engineering
AI Frameworks & Libraries
PyTorch
TensorFlow
Scikit-learn
Hugging Face Transformers
LangChain
LangGraph
MLOps, LLMOps & AgentOps
MLOps
LLMOps
AgentOps
Model Deployment and Serving
Agent Deployment
Model and Agent Observability
Prompt and Response Tracing
AI Cost Optimization
AI Evaluation, Safety & Governance
LLM Evaluations
Agent Evaluations
RAG Evaluations
AI Guardrails
Prompt-Injection Protection
Red Teaming
Responsible AI
AI Governance
Cloud AI Technologies
Google Cloud
Vertex AI
Gemini Models
Agent Studio
Vertex AI Agent Builder
Agent Development Kit
Vertex AI Vector Search
Google Cloud Document AI
Google Cloud Vision AI
Microsoft Azure
Microsoft Foundry
Microsoft Copilot Studio
Microsoft Agent Framework
Azure AI Document Intelligence
Azure AI Speech and Vision
Microsoft Fabric
Microsoft Purview
Language, Vision, Speech & Document AI
NLP, NLU and NLG
STT, TTS and ASR
Conversational AI
Document Intelligence
Computer Vision
RAG, Search & Knowledge Systems
Enterprise RAG
Agentic RAG
Multimodal RAG
Enterprise Search
Semantic & Hybrid Search
Vector Databases
Knowledge Graphs
Reranking and Retrieval Optimization
RECOGNITION
Explore the awards and industry recognition associated with Tech.us.
FAQ
Tech.us provides data collection, predictive analytics, prescriptive analysis, diagnostic analysis, descriptive analysis, big data analytics, customer analysis, and security and risk analysis.
Descriptive analytics explains what happened. Diagnostic analytics examines why it happened. Predictive analytics estimates what may happen based on historical patterns. Prescriptive analytics helps evaluate what actions could be considered in response.
The source specifically identifies data from ERP systems, CRM platforms, IoT devices, servers, websites, mobile applications, networks, financial platforms, and other organizational systems.
Analytics turns raw information into findings that can help organizations understand trends, customer behavior, operational performance, risks, and other factors relevant to a business decision.
Big data analytics focuses on large, high-volume, or high-velocity datasets. It can involve both structured and unstructured information and requires methods for organizing, segmenting, and analyzing data at greater scale.
Yes. The source specifically states that Tech.us works with structured and unstructured data as part of its big-data analytics services.
Tech.us consolidates information from different sources and can use unified data platforms, data lakes, cloud architectures, and ETL processes to bring that data together for analysis.
Tech.us uses controls that include data encryption, multi-factor authentication, and role-based authorization to protect sensitive information used during analytics.
Customer analytics examines behavioral information from customer interactions, including activity across websites and mobile applications, to identify patterns in how customers engage with digital products or services.
Analytics can help identify anomalies and patterns that may indicate areas requiring further investigation. The source includes operational systems, networks, financial platforms, and cybersecurity environments within its security and risk analysis capability.
The source describes validating and enriching data, applying data-governance practices, and using analytical or machine-learning methods to identify anomalies that could affect data quality.
Analytics initiatives can bring information from separate systems into a centralized or unified environment, making it easier to analyze information across sources rather than treating each dataset independently.
Build analysis around the questions your organization actually needs to answer.
Talk to Our Expert →We value your privacy
By continuing to use this website, you agree to our Privacy Policy.
If you decline, your information won’t be tracked when you visit this website. A single cookie will be used in your browser to remember your preference not to be tracked.
Necessary cookies keep the site running and are always on. Turn the others on or off to control how Tech.us uses them.
Required for the site to function. Cannot be disabled.
Help us measure traffic and see how visitors use the site so we can improve it. All information is aggregated.
Used to deliver and personalize ads, measure campaign performance, and share data with advertising partners (including Retention.com and RB2B).
For residents of California and other states with similar rights. Turning this on opts you out of the sale or sharing of your personal information for targeted advertising (this also disables Advertising cookies).
Learn more in our Cookie Policy and Privacy Policy. You can change these settings at any time.